Project 03 / 07 / shipped
Tarn
Scores a billion real logins from a US national lab for signs of a known attacker, then an AI analyst sorts the alerts.
From the write-up
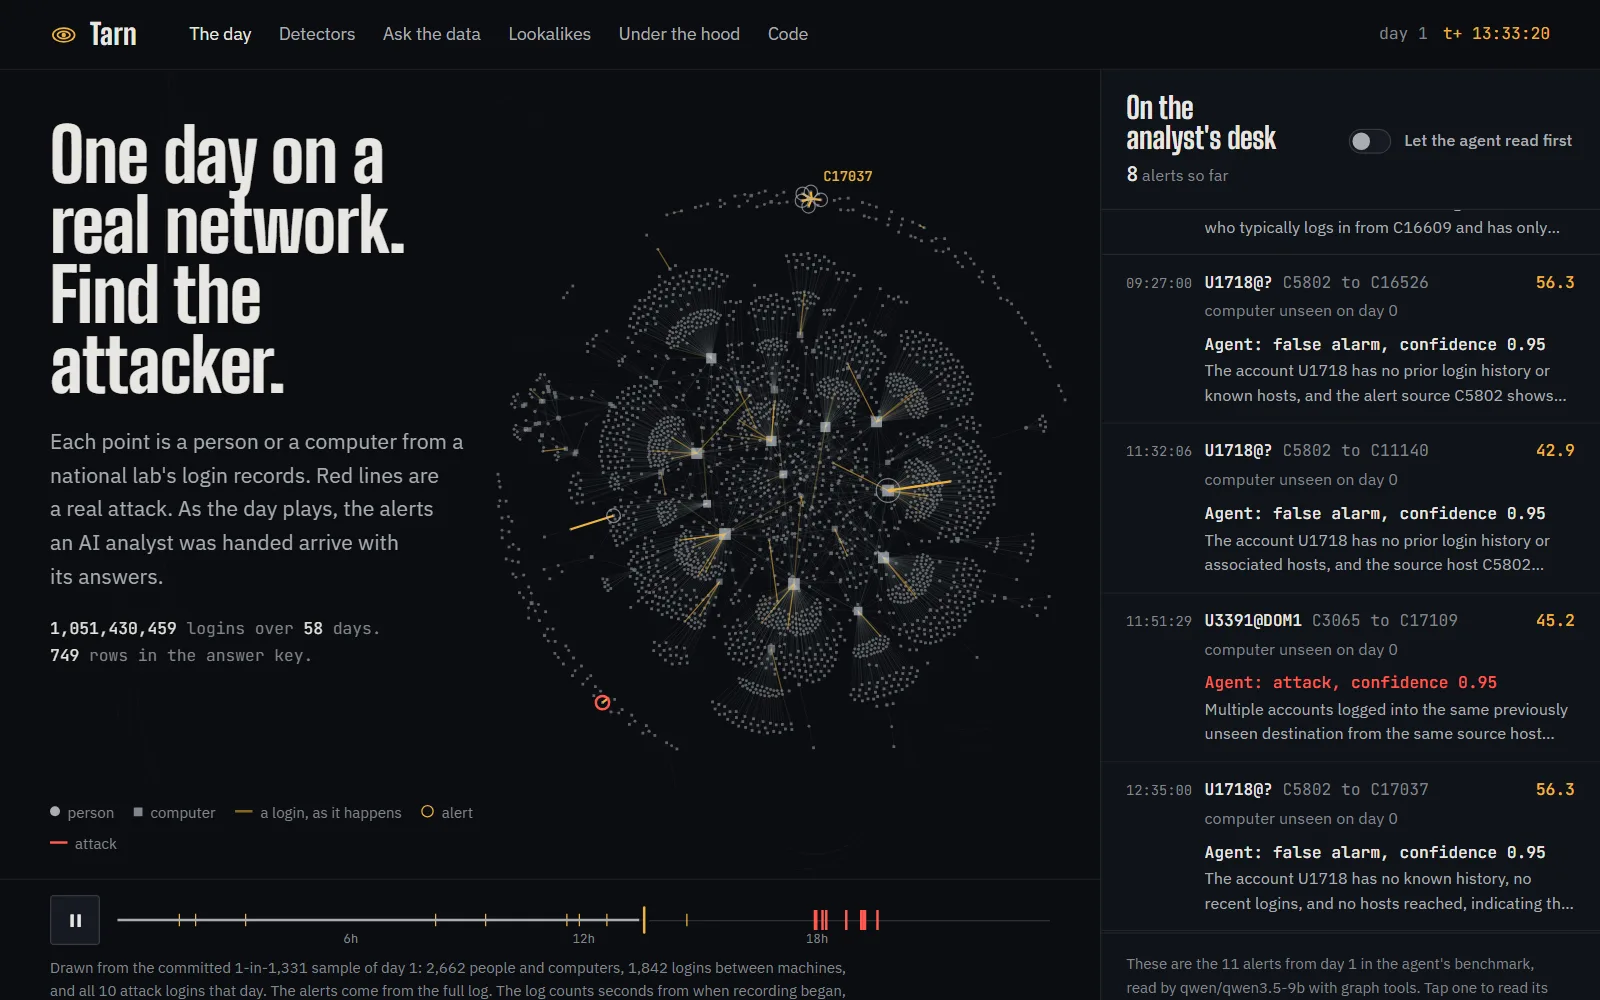
Tarn takes a billion real login records from a US national lab, where 749 are a known attack, and asks one question: would this have caught the attacker? A map of who logged into which computer is scored as each login arrives and raises alerts. Then an AI analyst with map tools sorts those alerts so a person only reads the ones that matter. Every result below is checked against the lab's answer key, including the ones that came out badly.
Headline numbers / 2
- Days of real attacker activity caught when an analyst reads only 100 alerts a day. The first version caught 21. Most still got through.
- 29 of 181most still got through
- From the Tarn README, graph detector budget table, rows v2 graph detector and v1.
- Detector inputs recomputed with the future hidden, to prove it never peeked ahead. Zero mismatches.
- 5,079,642zero mismatches
- From the Tarn README, point-in-time check table, row v2 feature engine.
Decisions I made and things that broke
- Everything the detectors learn comes from the first day only, and the code refuses any fit that reaches past it, so no test day leaks in.
- After scoring, I found the old night-time rule pushed ordinary night logins to the top. Without it, the detector caught attacker activity on 71 of 181 days, not 29.
- The analyst test stopped early when another job took over the laptop's graphics card, so only 49 of 600 alerts were scored.
What this proves / 11 skills
AI / ML
- Python
- The detector, the checker and the scoring are Python, reading a local copy of the full login log.
- Model evaluation
- Every detector learns only from the first day and is scored against the lab's answer key, bad results included.
- Calibration
- The analyst's confidence was close to its real hit rate, off by 0.04 with map tools and 0.05 without. Only 49 alerts were scored.
- Tool-using agents
- An AI analyst asks questions about the login map through a fixed list of tools. Made-up tool calls are refused.
- Fraud and anomaly detection
- At 100 alerts a day, it caught attacker activity on 29 of 181 days. The first rules caught 21. Most still got through.
Systems
- Spark
- Batch and live scoring share one Spark code path over the full log of about a billion events.
- DuckDB and dbt
- The first version keeps a dbt and DuckDB warehouse over the stored logins.
- Stream processing
- Each login is scored as it arrives, and logins in the same second never see each other.
- Neo4j
- The first version keeps a Neo4j graph of which user logged into which computer.
- Point-in-time features
- Detector inputs were recomputed with the future hidden, about 5.1 million of them. None changed, so nothing peeked ahead.
Infrastructure
- Tests and CI
- Automated checks run the same code on a small saved slice of the log and fail if the tables drift.
The demo, recorded
Papers / 3
- arXiv 2607.29390, Fair evaluation of graph-based lateral movement detectorsEvery detector learns only from the first day and gets the same 100 alerts a day, so the comparison is fair.
- arXiv 2608.22389, KONTOGRAPHIt led to the checker that recomputes detector inputs with the future cut off, to prove none of them peeked ahead.
- arXiv 2609.19425, Closed-world resolution against tool hallucinationThe analyst can only call tools from a fixed list, so a made-up tool call is refused and counted, never run.